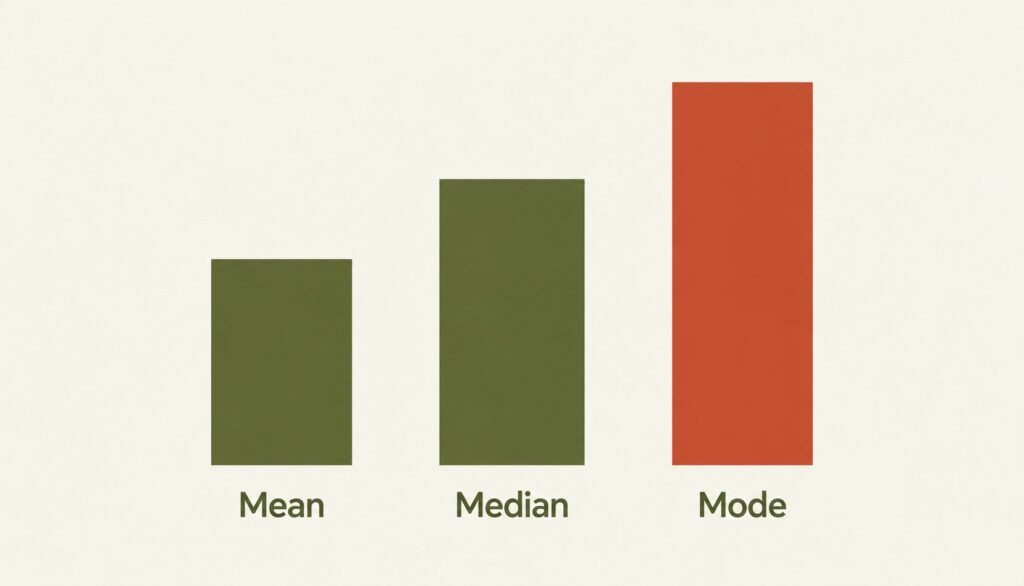
Mean, median and mode from a plain list of numbers is arithmetic anyone can do. The version that appears in a BBA statistics paper — grouped, continuous data in class intervals — is a different task, with its own formulas and its own places to lose marks.
- Use the midpoint for the mean, not the class boundary.
Mean = Σfx ⁄ Σf, where x is the class midpoint. The most common error is using the class itself — “20–30” — instead of its midpoint, 25. Write the midpoint column first, before anything else.
- Read the median’s four values in the right order.
Median = l + [(N⁄2 − cf) ⁄ f] × h. Find the median class first, by locating where N⁄2 falls in the cumulative frequency column — only then read off l, cf, f and h. Reading them out of order is where the mix-up happens.
- Do not forget the mode formula — it is the one students blank on.
Mode = l + [(f₁ − f₀) ⁄ (2f₁ − f₀ − f₂)] × h. Because it is used less often than the other two, it is the one most likely to be half-remembered in the exam. Write it from memory, cold, once a week before the exam.
- Sanity-check all three answers against each other.
For moderately skewed data, mean, median and mode should sit in a sensible order. If the mode is nowhere near the median and mean, or falls outside your data’s range, a formula was applied to the wrong row.
Statistics from a frequency table rewards a consistent method more than natural ability. If this is where your BBA marks are going, bring your own numbers in to Sector 12 and we will go through the table together.